SUSE Cloud Observability quick start guide
Overview
After purchasing SUSE Cloud Observability from the Cloud Provider Marketplace, your SUSE Cloud Observability environment is provisioned.
You will receive an email from SUSE Cloud Observability with the required login details and links to your environment. This quick start guide will help you get started and get your own data into your SUSE Cloud Observability deployment.
Getting Started - First Steps
-
Setup a password
-
Login to your SUSE Cloud Observability Instance
-
Install SUSE Observability agent to your cluster
-
Change your personal account details
Setup a password
The email from SUSE Cloud Observability contains a unique link which allows you to set your initial password on the account. This must be performed before you can login and configure the observability environment.
Accessing your SUSE Observability Environment
Login in to your SUSE Cloud Observability environment by clicking on the unique link in the email you received from SUSE Cloud Observability. Entering your password will take you to the configuration screen in order to add clusters.
Change your personal account details
Step 4 from your email is to update your personal information. Click the unique link from the email and add your basic personal details as needed. You can also setup 2FA authentication from this section if required.
Explore your data
To start exploring your data, open the main menu by clicking in the top left of the screen and go to Kubernetes to reveal a list of observable items.
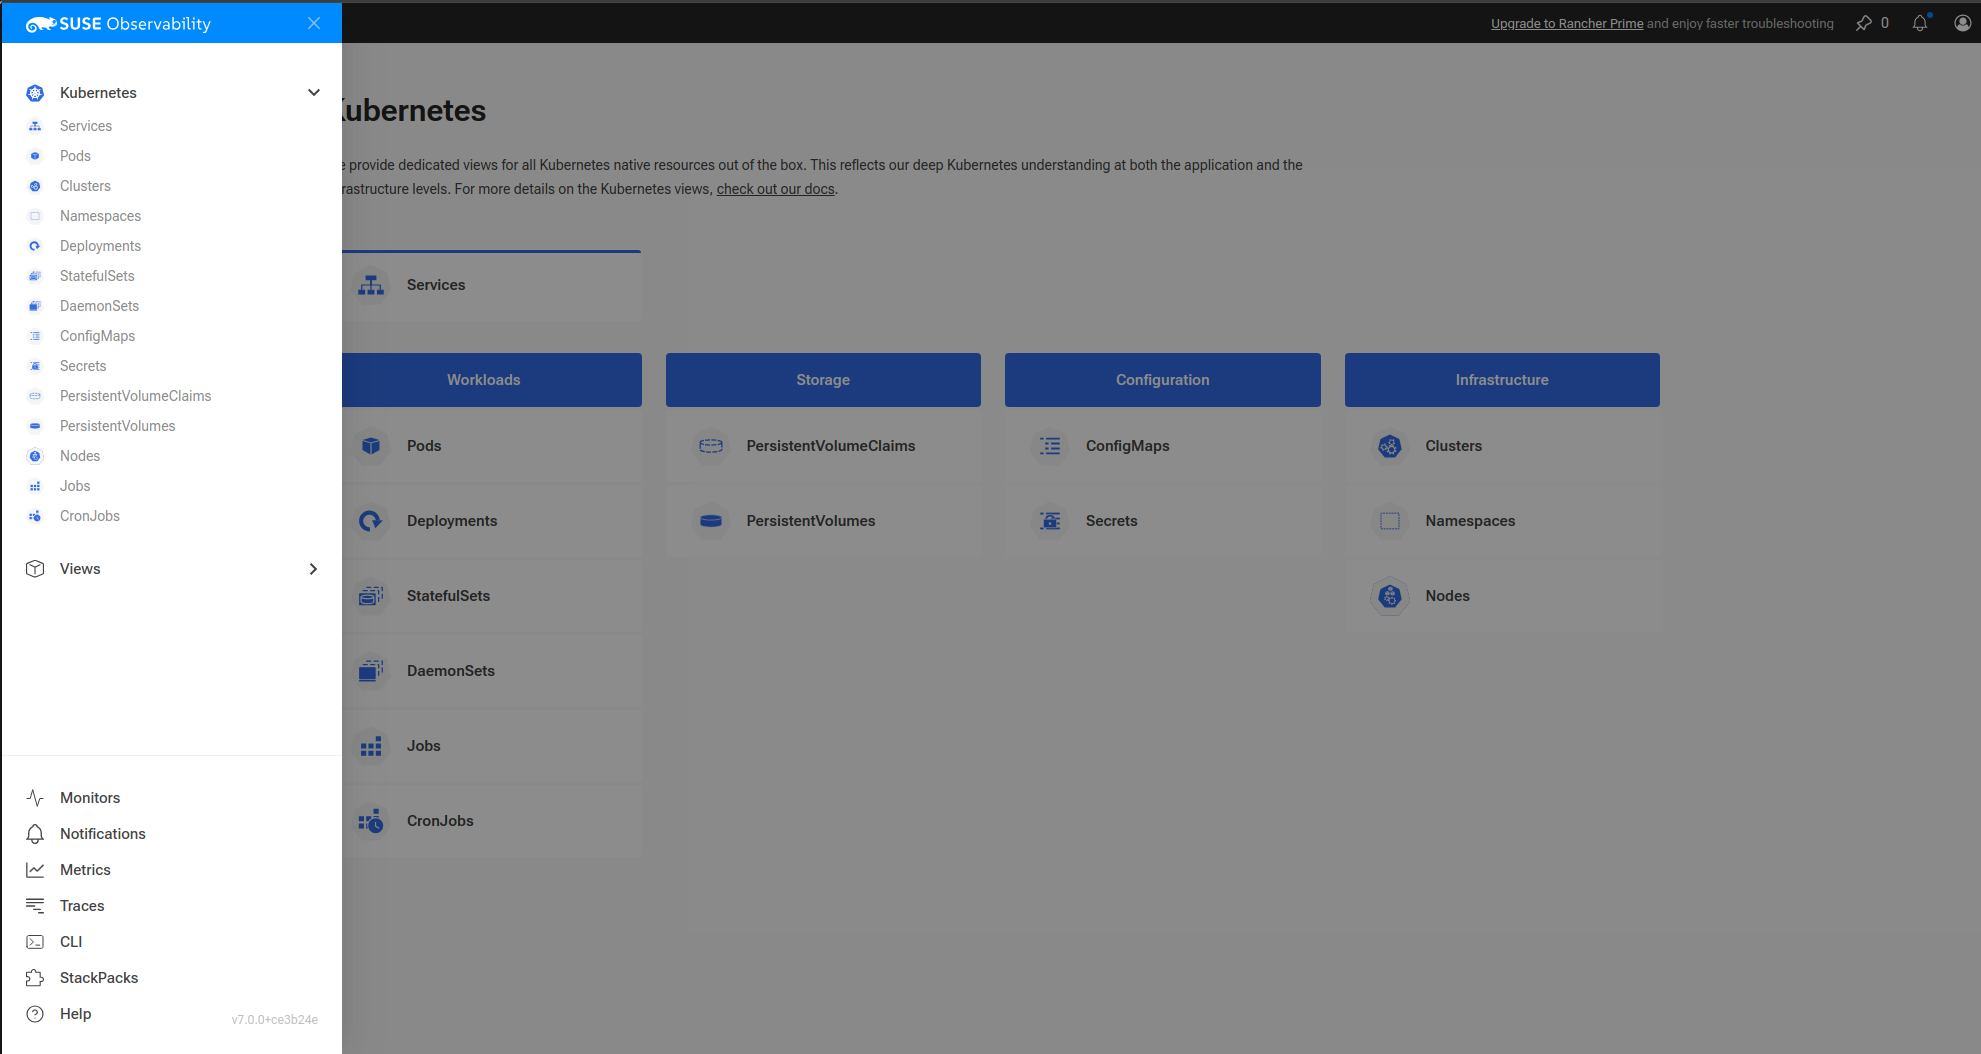
Select 'Clusters' from the infrastructure section which should show a list of monitored clusters, select your cluster to reveal one of the many built in views.
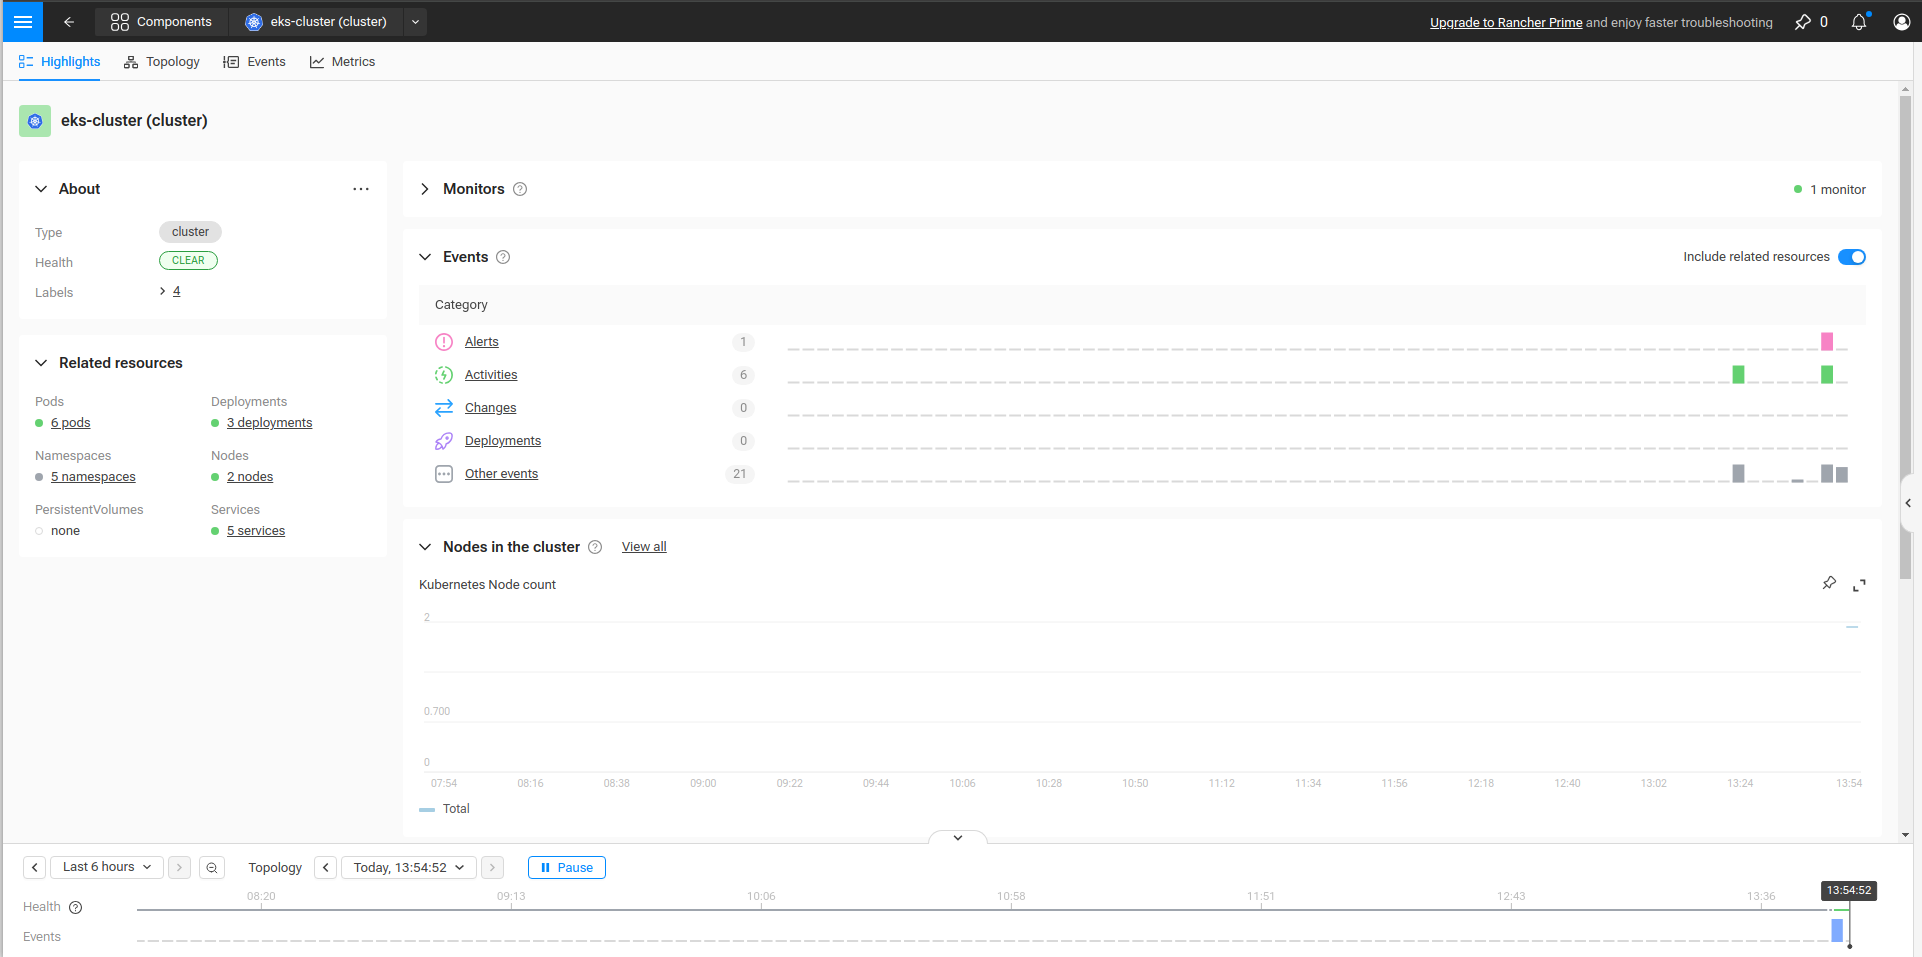
At this point you can start exploring the data for your cluster or add more clusters from which to gather data.
For further information on how to use SUSE Cloud Observability, including creating custom views please see the standard documentation.
SUSE Cloud Observability Limitations
Note that SUSE Cloud Observability does not provide out of the box RED signals (Rate, Errors and Duration), only the Rate signal is shown. This feature is available with SUSE Rancher Prime. Customers that need these signals to have a complete Observability solution should contact SUSE to discuss SUSE Rancher Prime, alternatively this data can be collected using the OpenTelemetry collectors.
Additional Information
For further information, including prerequisites and supported Kubernetes versions for your platform, please refer to the quick start guide.